|
I. This Week's Plan
This week you investigate acceleration and combinations of signature
motions using a new tool, an accelerometer. As your study continues,
you explore more and more complex motions, how they can be represented
and how they can be compared. You learn to use a new representational
tool for describing signature motions: vectors.
Goals for the week:
- Understand that acceleration means to speed up, slow
down, or change direction.
- Gain a relative sense of the amount of acceleration involved in
differing motions.
- Learn how to analyze complex motions by finding their component
building blocks.
- Begin to think how motion can be represented in terms of vectors.
What you need:
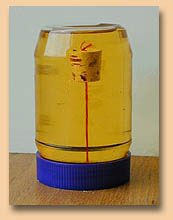
- An 16 oz. plastic jar with lid (from your Physics Kit)
- A small cork with a hole in it (from your Physics Kit)
- 20cm of heavy thread or lightweight string (preferably a dark color)
- 16 ounces of cooking oil
- A needle
- Paper towels
- A toothpick or cotton swab
- Overhead transparencies
- Transparency pens
Back to Top
II. Investigating Acceleration
Using a New Tool (~5 hours)
 When
is an object accelerating? If you were sitting in the back corner of
a bus and couldn't see out of the windows, how would you know if the
bus was accelerating or going at a constant velocity? When
is an object accelerating? If you were sitting in the back corner of
a bus and couldn't see out of the windows, how would you know if the
bus was accelerating or going at a constant velocity?
To investigate this question, this week we will make and use a new
tool -- an accelerometer which indicates acceleration. This tool can
be constructed out of common materials found in your Physics kit and
in your home.
Before beginning the investigation below, build
your accelerometer. This will take you about an hour.
- Part A: Seeing Acceleration with the New Tool (~2 hours)
-
| Note: Remember that physicists have a broader definition of
acceleration than we use everyday. It includes speeding up, slowing
down, and changing direction. Keep this definition in mind --
your accelerometer will register acceleration whenever its motion
changes in any of these ways. |
The tool you just built measures acceleration -- that is, speeding up,
slowing down, and changing direction.
As you investigate how this new tool behaves, you will probably wonder
why it works the way it does. If so, read Understanding
the Accelerometer by Robert V. Lange. For now, keep that question
in the back of your mind and focus instead on careful observation
of your accelerometer. Your job is to figure out how to "read" its
meter.
|
 When
the cork leans to the right, it is accelerating to the right. When
the cork leans to the right, it is accelerating to the right.
 When
the cork moves to the left, it is accelerating to the left. When
the cork moves to the left, it is accelerating to the left.
|
How does the accelerometer indicate changes in velocity? Any change
in velocity is indicated by a change in the position of the cork .
For example, speeding up, slowing down, or even a change in direction
will cause the cork to move. The cork always leans in the direction
of the acceleration. The more it leans, the greater the acceleration. .
For example, speeding up, slowing down, or even a change in direction
will cause the cork to move. The cork always leans in the direction
of the acceleration. The more it leans, the greater the acceleration.
-
Direct Observation: What happens when you move the accelerometer
in various ways? Turn the jar upside down so that the lid is on the
table (or any other flat surface). Slide your accelerometer across
the surface -- start, stop, speed up, slow down, crash, move back
and forth, and start-stop-start-stop. This accelerometer is quite
subtle and sometimes its "readings" are small, so watch closely.
Now stand up and hold the accelerometer in your hand. See what it
does when you move around the room in different ways. Walk forward,
stop, spin in a circle, move in any other ways you'd like. Investigate
at least 10 motions, including the signature motions. What happens?
What changes do you see in the position of the cork? When do changes
occur?
Pay particular attention to two things:
-
- What direction the cork moves; and
- How much the cork is leaning with each movement, comparatively.
Are there predictable patterns in how the accelerometer behaves?
In your journal:Use diagrams and sketches as well as words to
record what happened. Note your questions and observations and describe
any patterns of motion that you identified. How does the position of
the cork vary for each signature?
- Part B: Investigating the Cart's Motions
-
 If
the accelerometer were installed on your cart, how would it behave?
What kinds of additional information do you think the accelerometer
could give you about the cart's motion? If
the accelerometer were installed on your cart, how would it behave?
What kinds of additional information do you think the accelerometer
could give you about the cart's motion?
Predict: What do you think would happen to the cork in the
two scenarios below?
We've drawn a velocity-over-time graph a third scenario,
labeling each section with the motion it represents and drawing the
acceleromoter reading that corresponds to each section of the graph.
Try drawing similar graphs as your predictions.
-
-
-
-
Scenario 1:
The cart always moves left to right, but starts, then stops, thenstarts,
and then stops.
-
-
Scenario 2:
The cart starts slowly moving left to right, accelerates to a constant
speed, then stops quickly, reverses direction and slowly speeds up
to a constant speed left to right; then it coasts to a stop.
-
|
For more practice interpreting complex motions
with the accelerometer, return to the graphs of complex
motion stories you drew in Session 2. Choose a few graphs
to work with. For each, label the sections of the graphs with
the signature motion they represent, then predict how the accelerometer
would behave during the motion, and label the sections of the
graph with the accelerometer reading you predict will happen.
Then act the motions out with the accelerometer. Compare your
experience with your predictions.
|
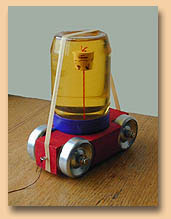
Direct Observation: Attach your accelerometer to your
cart with the wide elastic from your kit and act out the two complex
motion scenarios described above.
-
-
In your journal: Record your questions and observations. Describe
the patterns you see. How does the behavior of the accelerometer compare
with your predictions? What do you notice about the motion of the
cart when you use this tool?
-
Part C: A Closer Look With Video
-
In order to slow things down so that you can note the subtle
behavior of the cork and string, take a look at these accelerometer
videos. Ask yourself, "If the cork is in this position in
this frame, what does that say about the acceleration? What does it
say about how the motion is changing?"
-
As you study each video, use an overhead transparency and marker
to record the position of the cork in each frame, creating a film
strip of the frames. What patterns do you see?
 Draw
sketches in your journal, noting where the cork is in each frame and
what is happening to the accelerometer at that point. Draw
sketches in your journal, noting where the cork is in each frame and
what is happening to the accelerometer at that point.
When you have finished collecting your data, sketch a velocity over
time graph for each entire video. Include all the signature motions
that you note in the video, using your accelerometer data to inform
the process.
In your journal: Record your sketches, graphs, questions,
and observations. Describe the patterns you see. How does the position
of the cork vary for each signature? What additional information did
you gain from watching the videos?
-
|
Mathematical Note: Acceleration and velocity have some
important characteristics in common, mathematically. They both
have a size and a direction. (In the next session, you will
learn about force, which also has a size and a direction.) Mathematicians
represent these kinds of concepts as vectors, the general mathematical
term for something that has a size and a direction. A vector
can be represented by an arrow, pointing in the direction of
the vector, e.g. in the direction an object is moving. A number
on top of the vector can be used to represent its size.
 So,
for example, a vector of a velocity for 5 centimeters per
second moving left to right would look like this: So,
for example, a vector of a velocity for 5 centimeters per
second moving left to right would look like this:
 A
vector representation of a velocity of 5 cm/sec right to left
would look like this: A
vector representation of a velocity of 5 cm/sec right to left
would look like this:
Sometimes the length of a vector is used to represent its size.
For example, this might be 10 cm/sec moving left to right; this
  might be 2 cm/sec moving right to left.
In this course, since we will be working mostly qualitatively,
we will often use the length of vectors to indicate their relative
size.
|
Back to Top
III. Venturing Into the Outside
World (~1 hour)
What insights can your accelerometer give you about complex motions
in your everyday life?
 Take
your accelerometer for a ride or walk (by Tuesday). Preferably, take
it on some kind of public transportation so you can watch what it does
as the bus or subway moves. Your accelerometer's readings will be quite
dramatic in a bus! If you do take it in your car, be sure someone else
is driving! Take
your accelerometer for a ride or walk (by Tuesday). Preferably, take
it on some kind of public transportation so you can watch what it does
as the bus or subway moves. Your accelerometer's readings will be quite
dramatic in a bus! If you do take it in your car, be sure someone else
is driving!
In your journal: Record your findings. Did you see what you
expected to see? Did you observe any behaviors in your accelerometer
that you hadn't seen before? What additional information did you gain?
What new questions arose as a result of this experience?
Report and Discuss: Tell us what happened (by Tuesday in the
Motions in Your Life Forum). What did you learn about motions in
the real world? One thing you may have noticed is that the motions you
investigated with your accelerometer were much more complex than signature
motions and that the accelerometer's behavior was not always easy to
understand. Finding patterns in the accelerometer's behavior is an example
of choosing which aspects of a situation to pay attention to and which
to ignore.
Back to Top
IV. Analyze, Report, and Discuss
(~2 hours)
This video of the cart and accelerometer records
a complex motion. It will be the focus of your study group conversation
this week.
Observe the video, then analyze the motion of the cart. Generate a
strobe picture and draw a sequence of sketches that show the position
of the cork in the accelerometer for each frame.
Use the strobe and accelerometer information to create a velocity
over time graph of the cart's motion with PowerPoint. Label each segment
of the graph with the signature motion (e.g. speeding up, slowing down)
it represents in words, the direction of acceleration taking place and
what the accelerometer reads. You might also try to represent the velocity
and acceleration of each graph segment with vectors. Make sure you title
your graph.
Report: Share your procedures and analysis in the Physics
Forum, attaching a copy of your PowerPoint graph to your report
(by Tuesday). Did you have any surprises? Did any questions emerge?
If you are unsure about how to share your graph in the forum, read the
section about attaching files to discussion board messages in the PowerPoint
cribsheet.
Discuss: Compare your results with your colleagues. How are
your graphs the same? What differences do you note between your graph
and those of your colleagues? How do your explanations compare? What
questions still remain for you?
Back to Top
|
 -
-